Research methods
Competitors
analysis
Users
journey
Creation of
personas
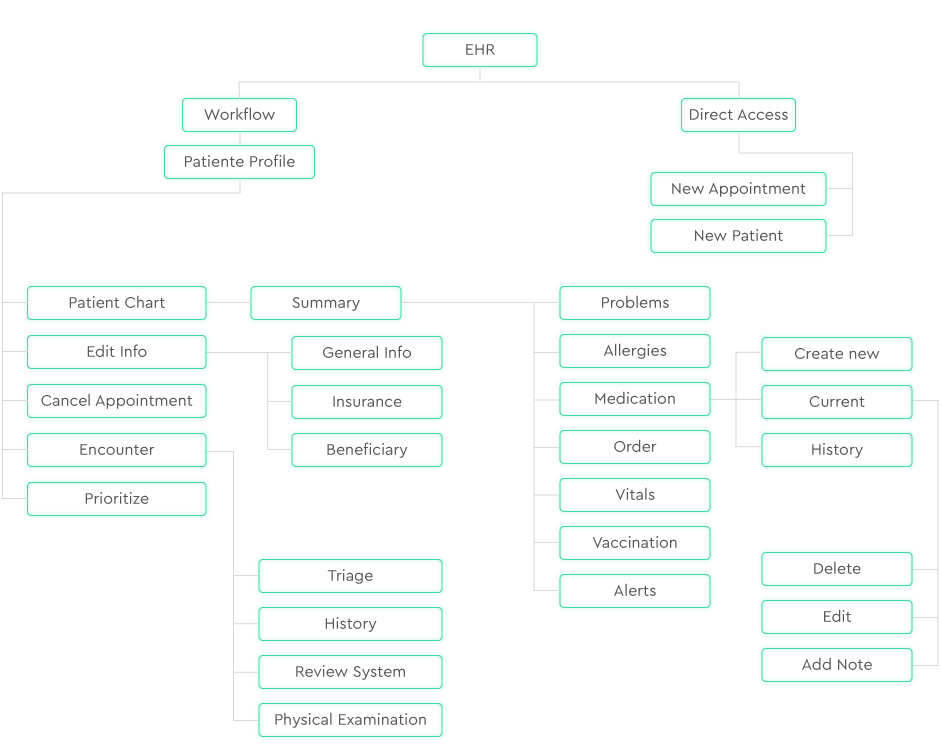
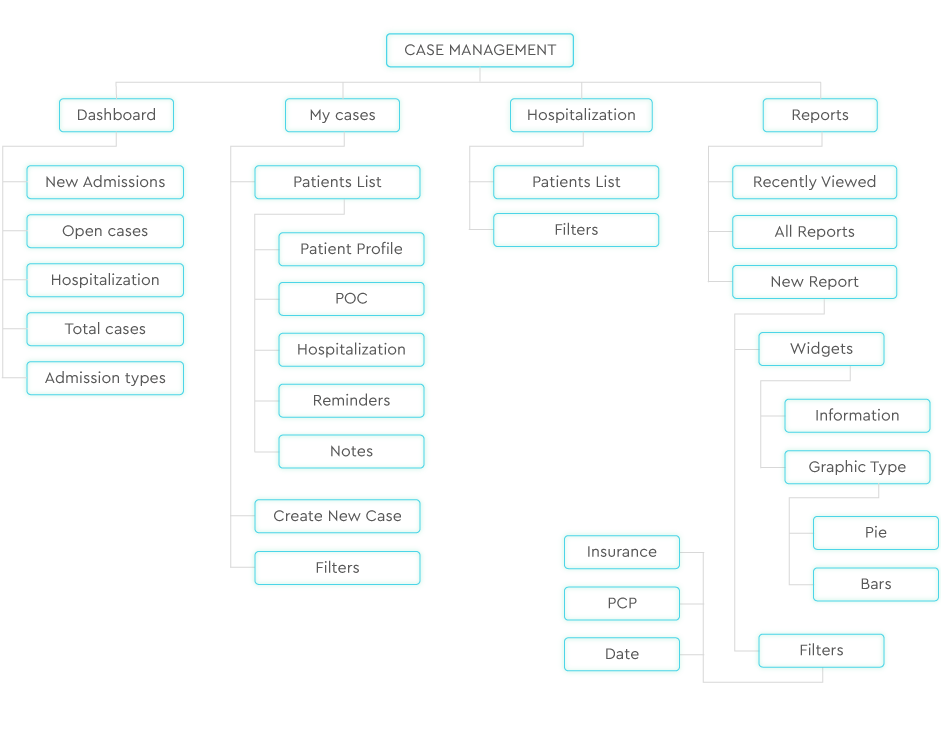
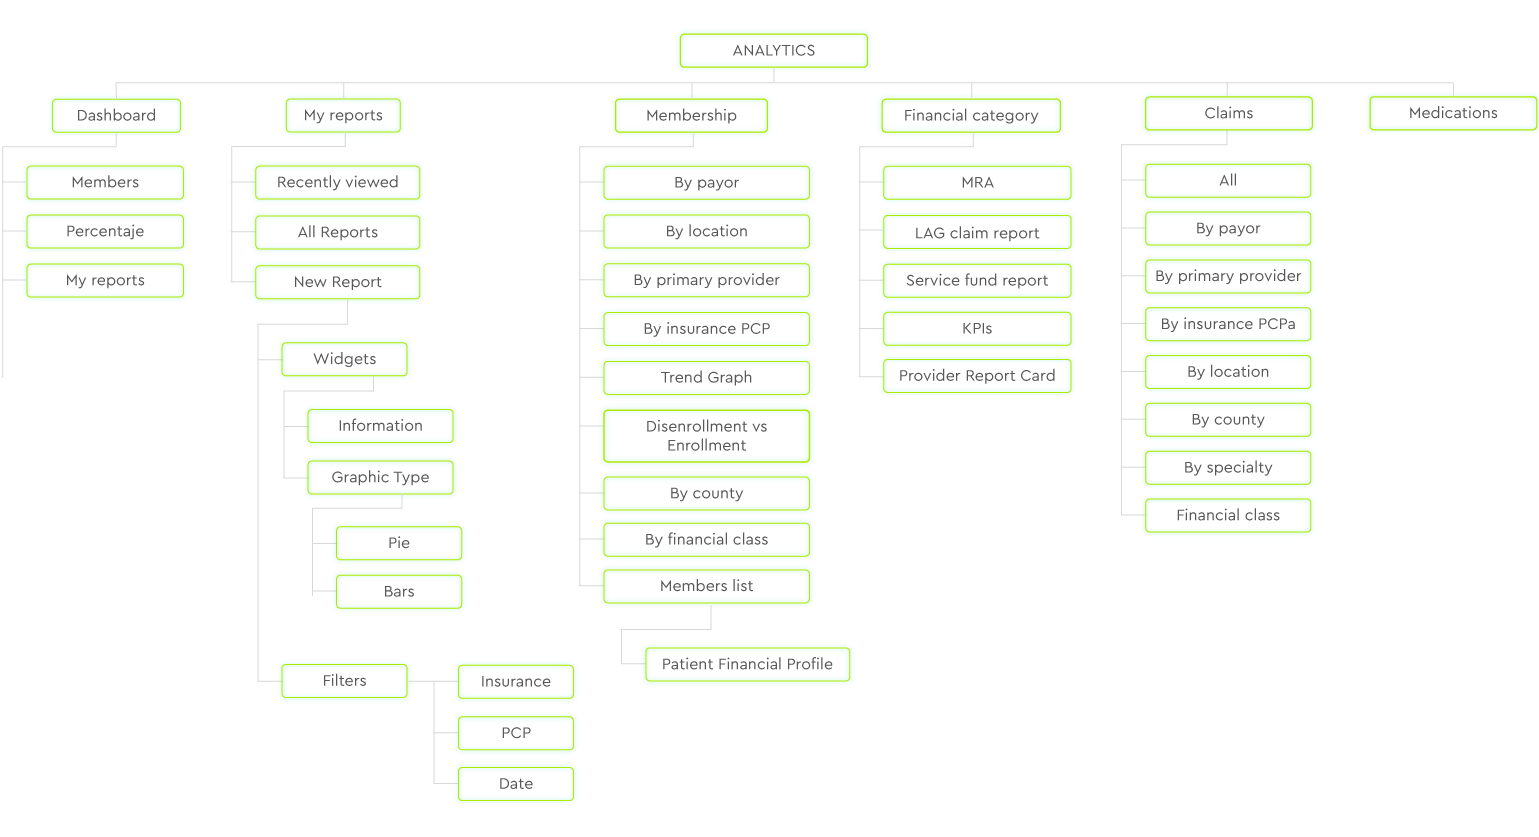
Sitemaping
Prototype
testing
My contribution to the team
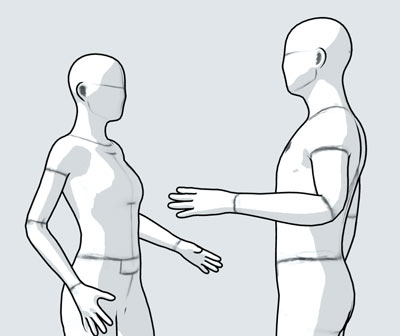
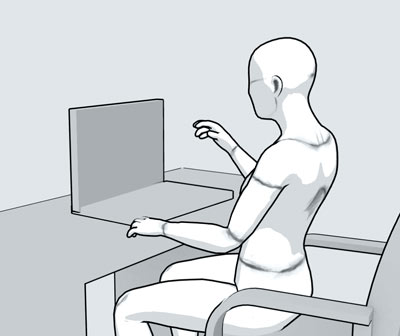
- Create the user's journey map: in order to understand who interacts with the application and what are their goals when using it.
- Collaborate with the competitor research: with the UX/UI team for the current products used by different hospitals and insurances in the USA in order to identify the pros and cons for each one.
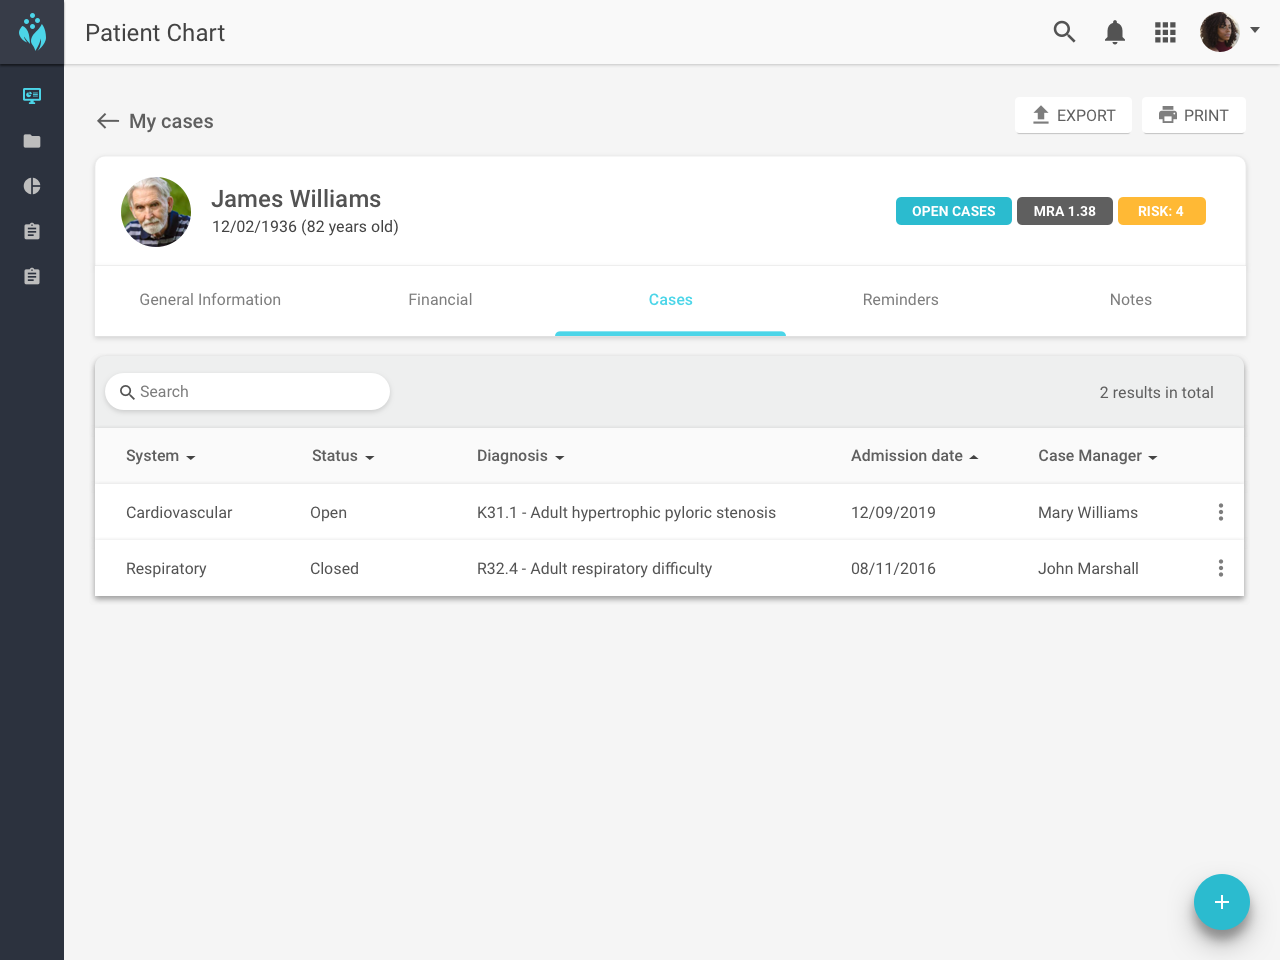
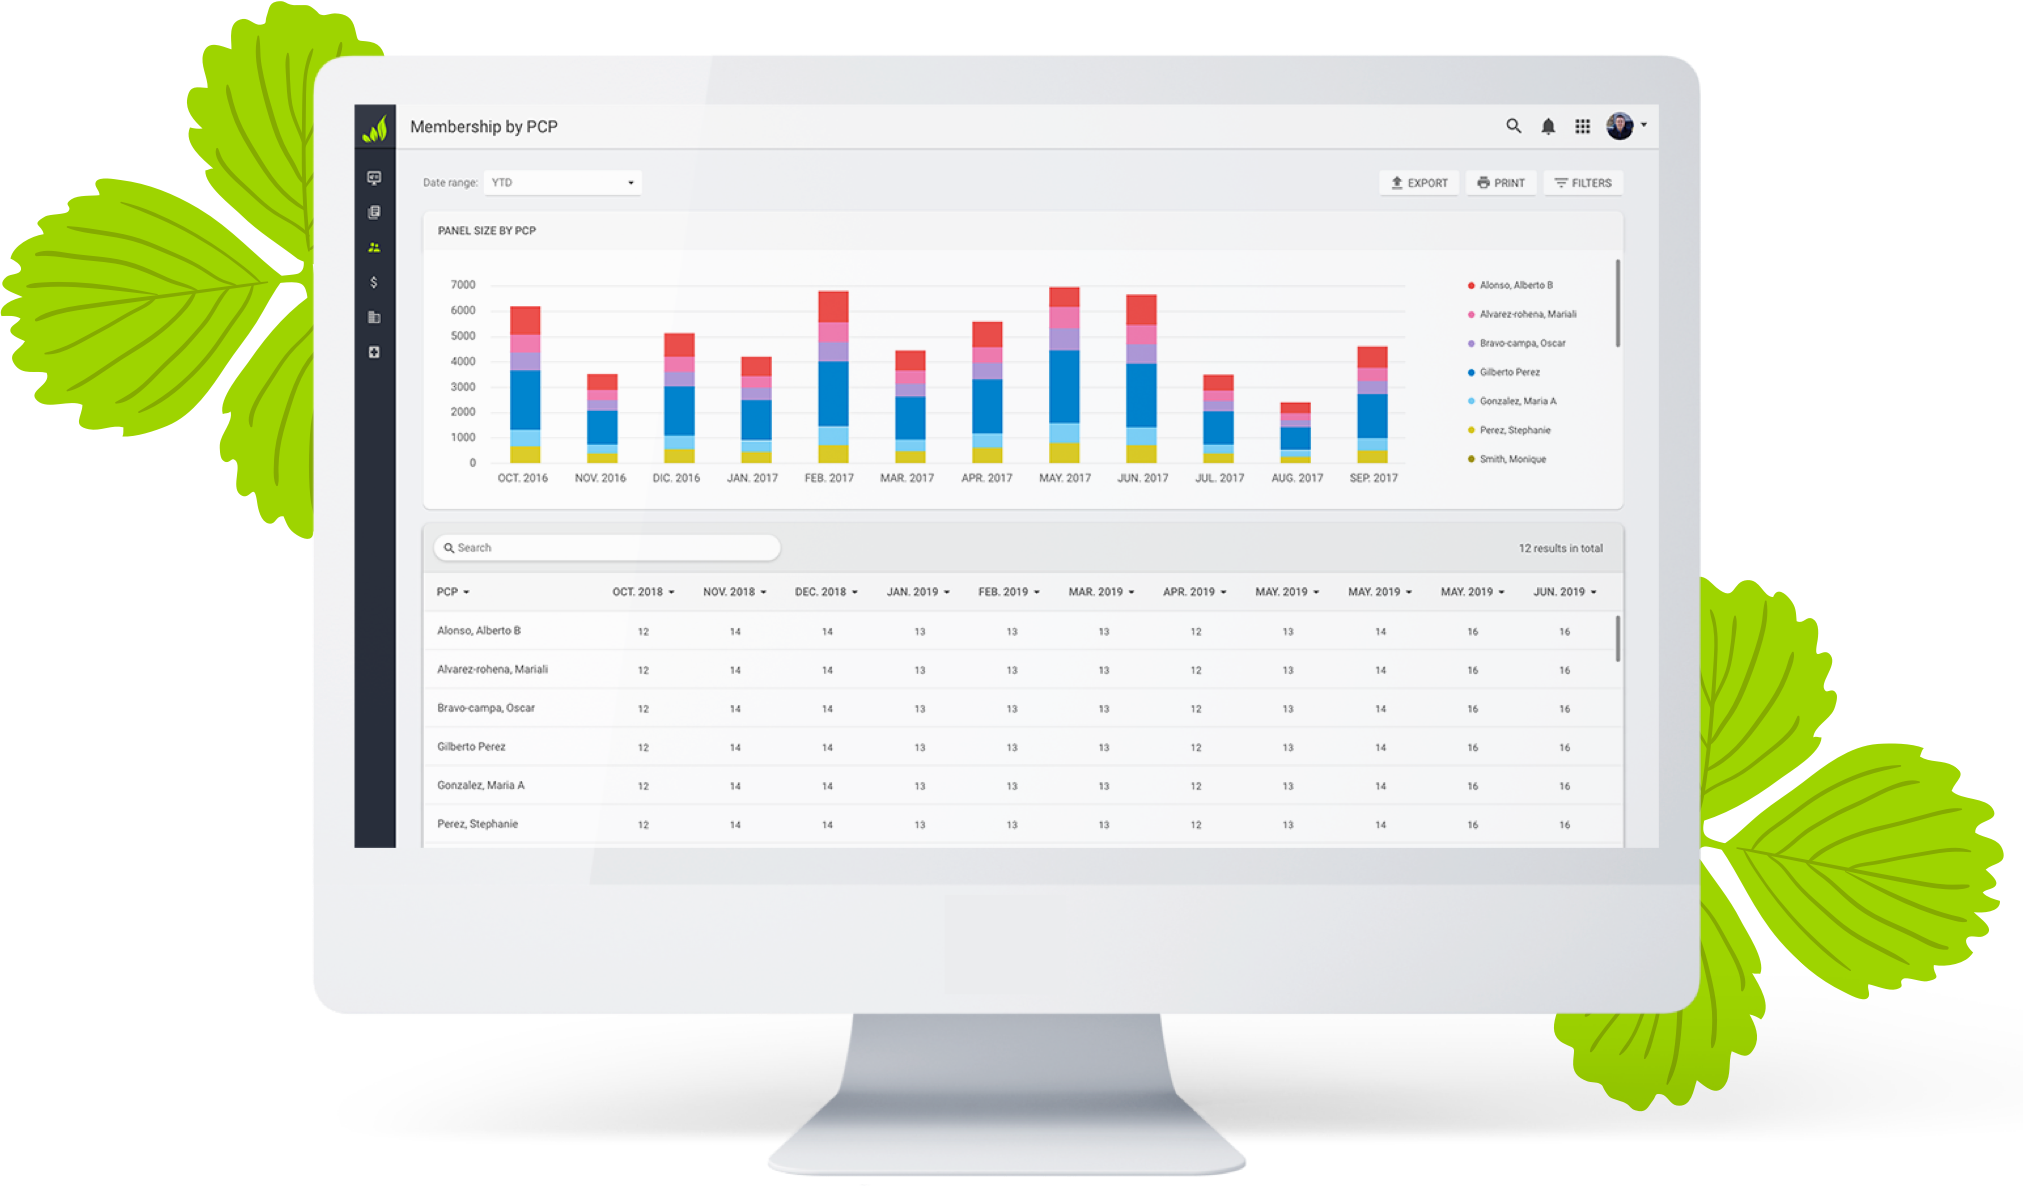
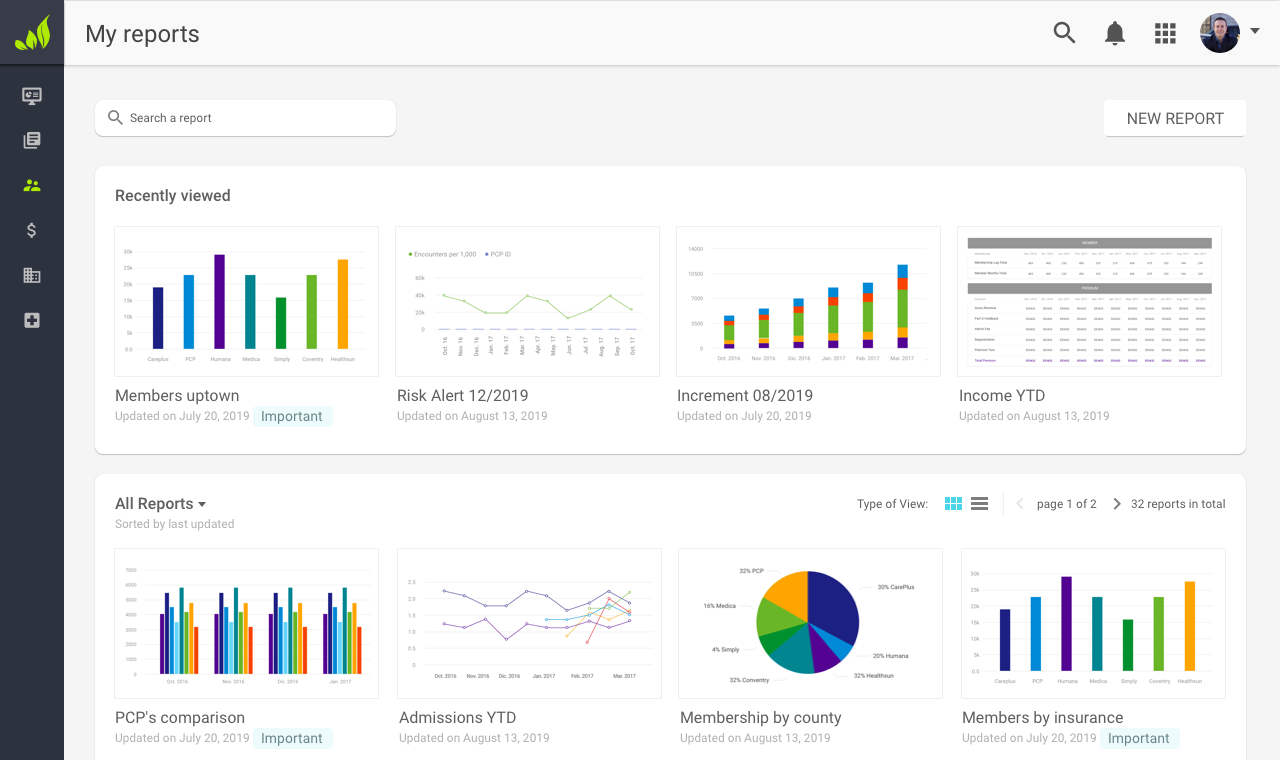
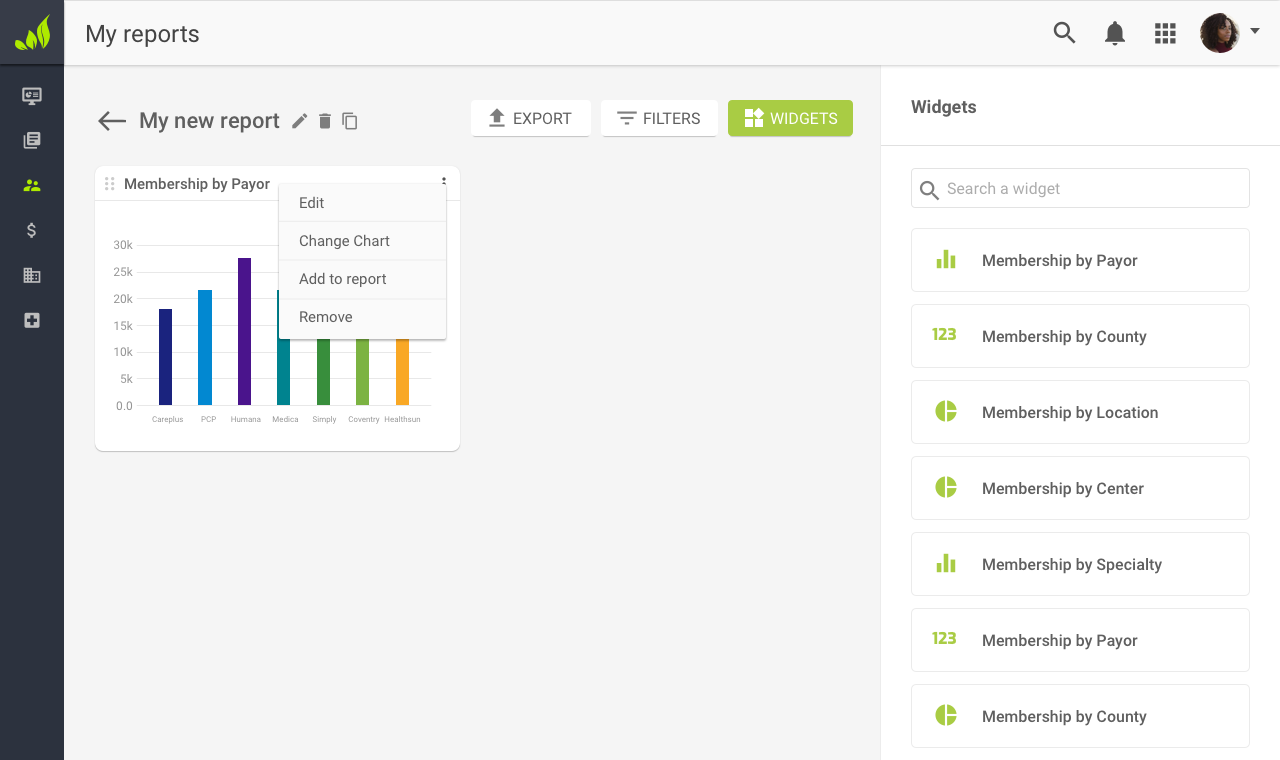
- Define the sitemap: interpreting the user's journey to organize the product's features.
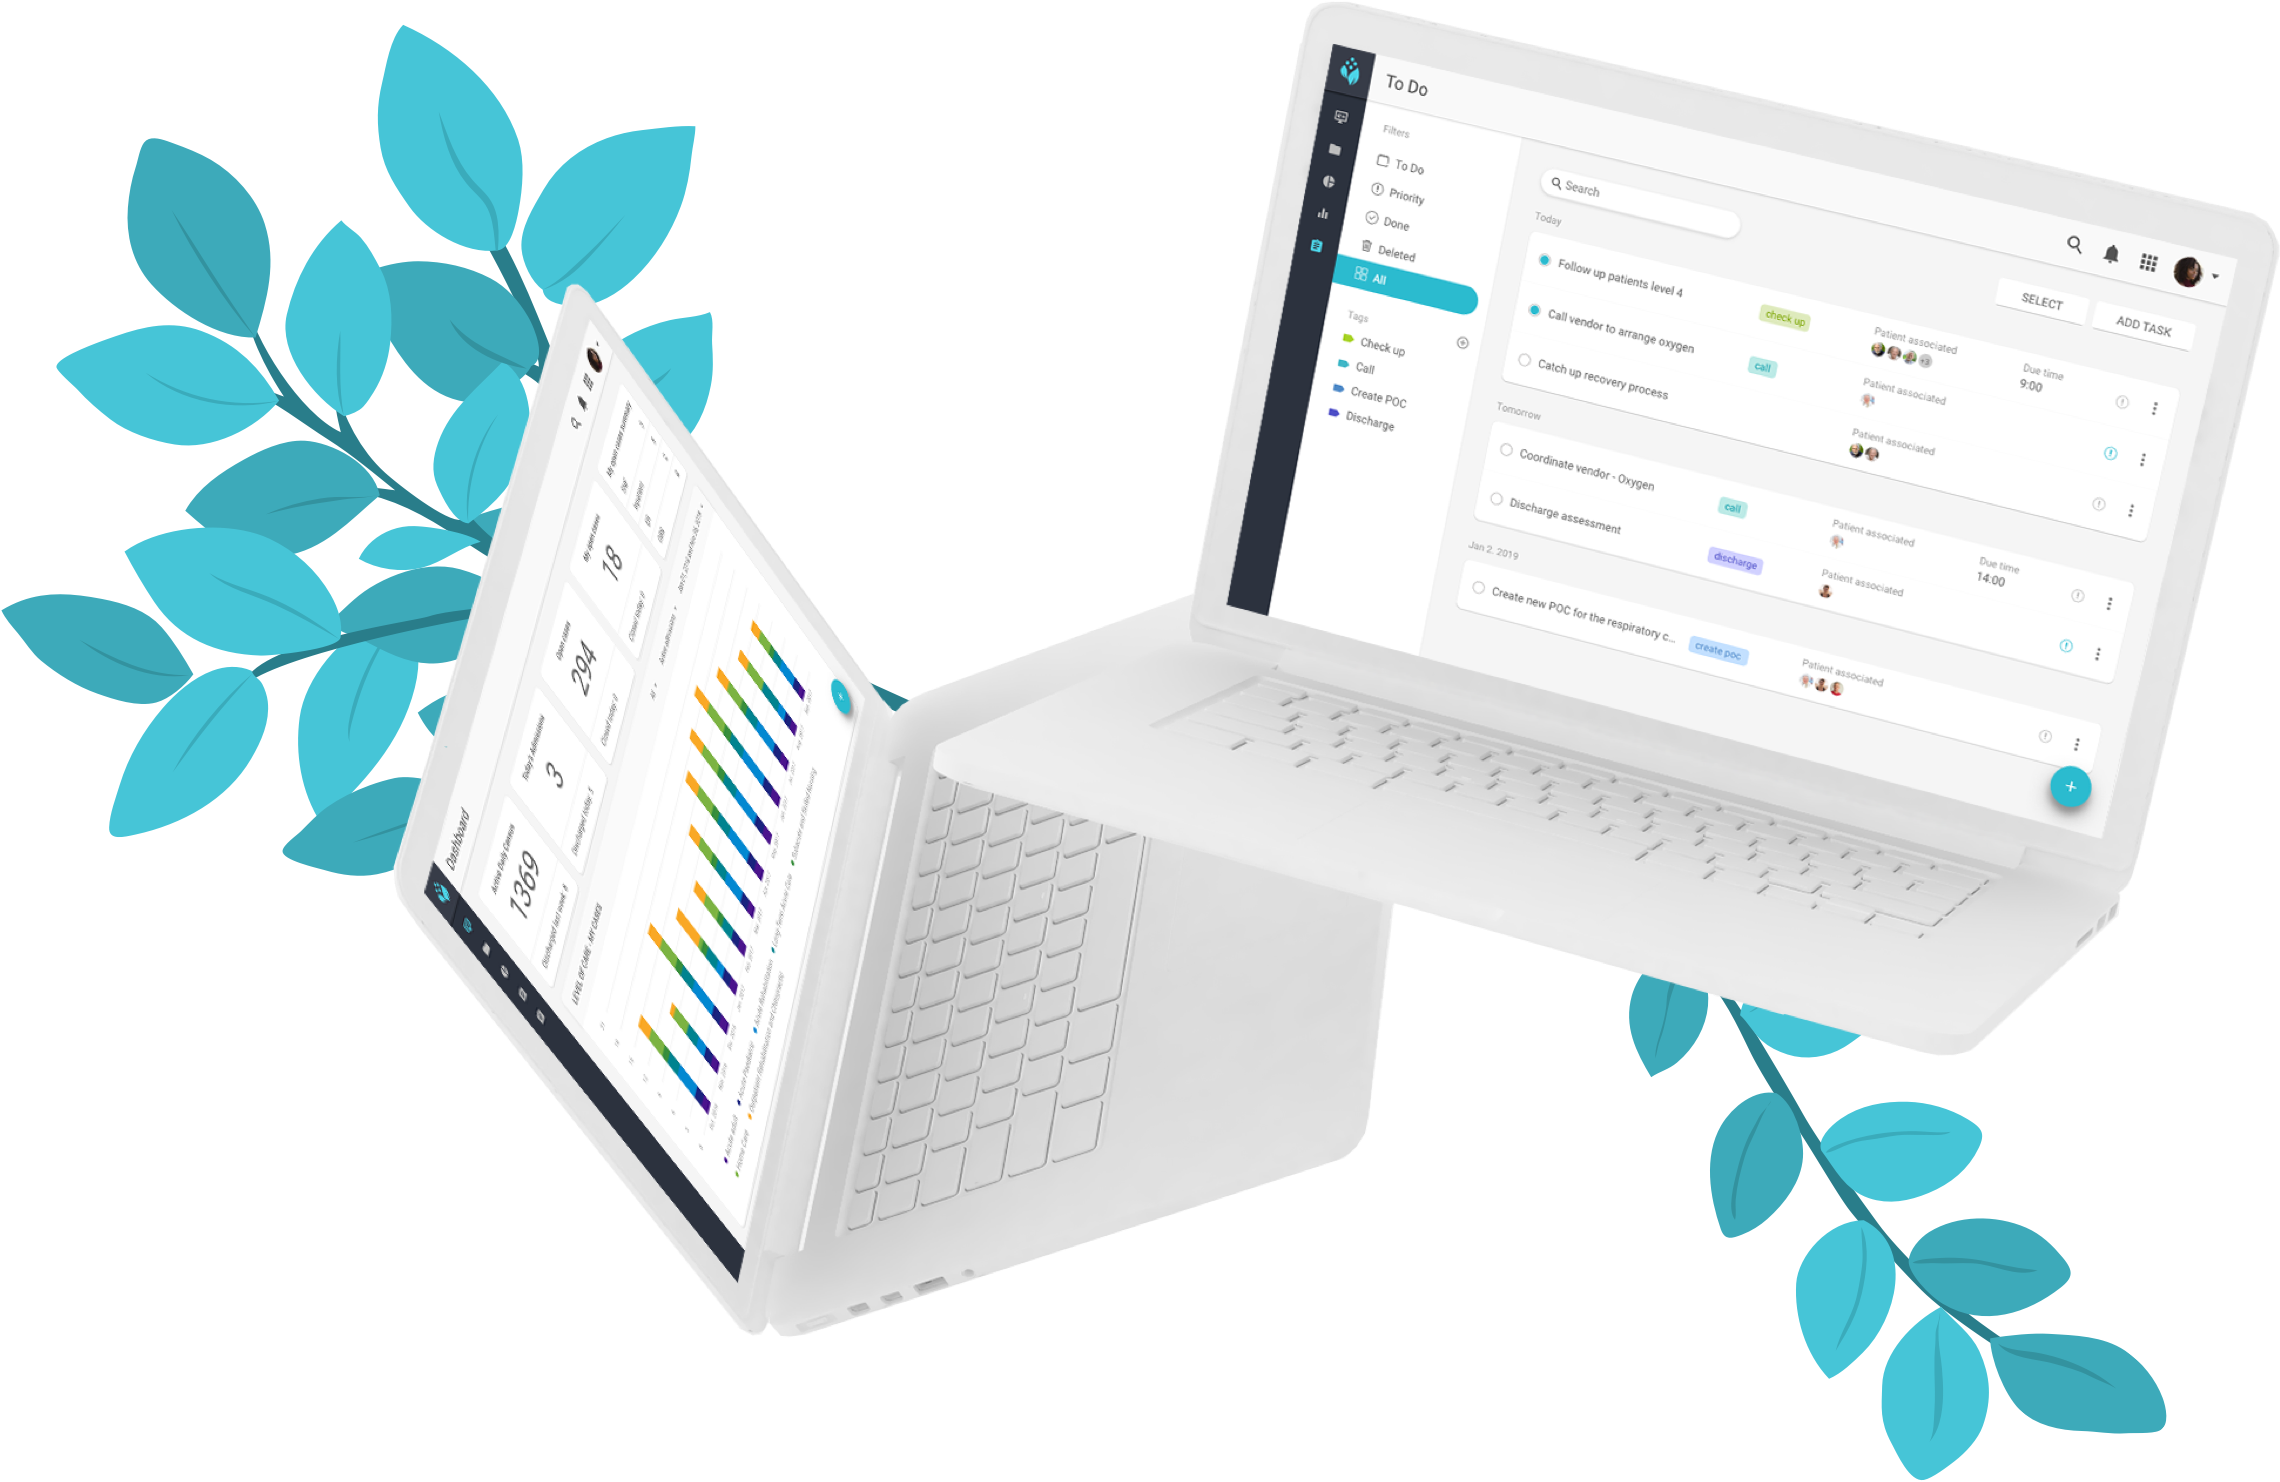
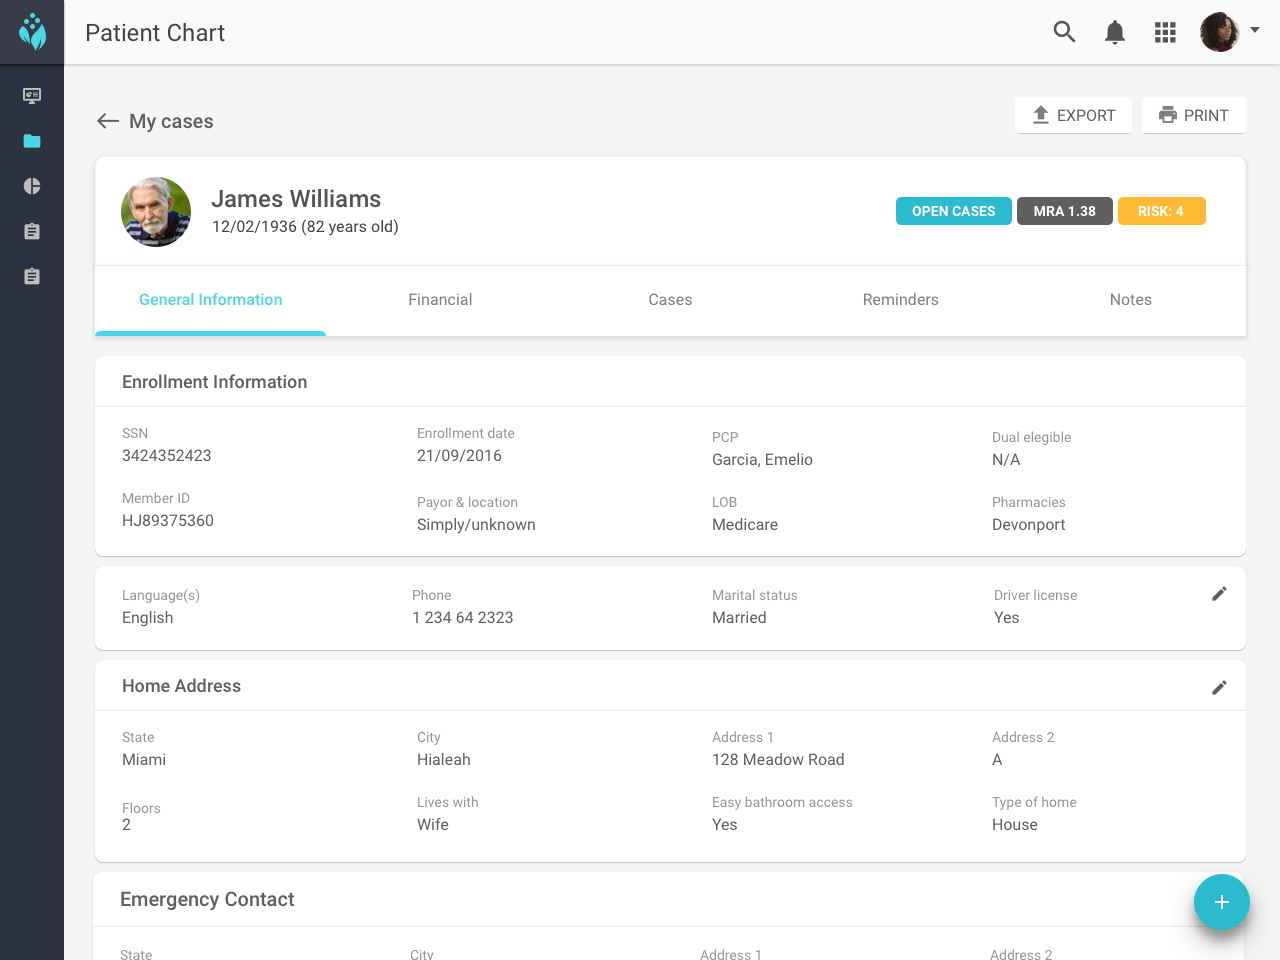
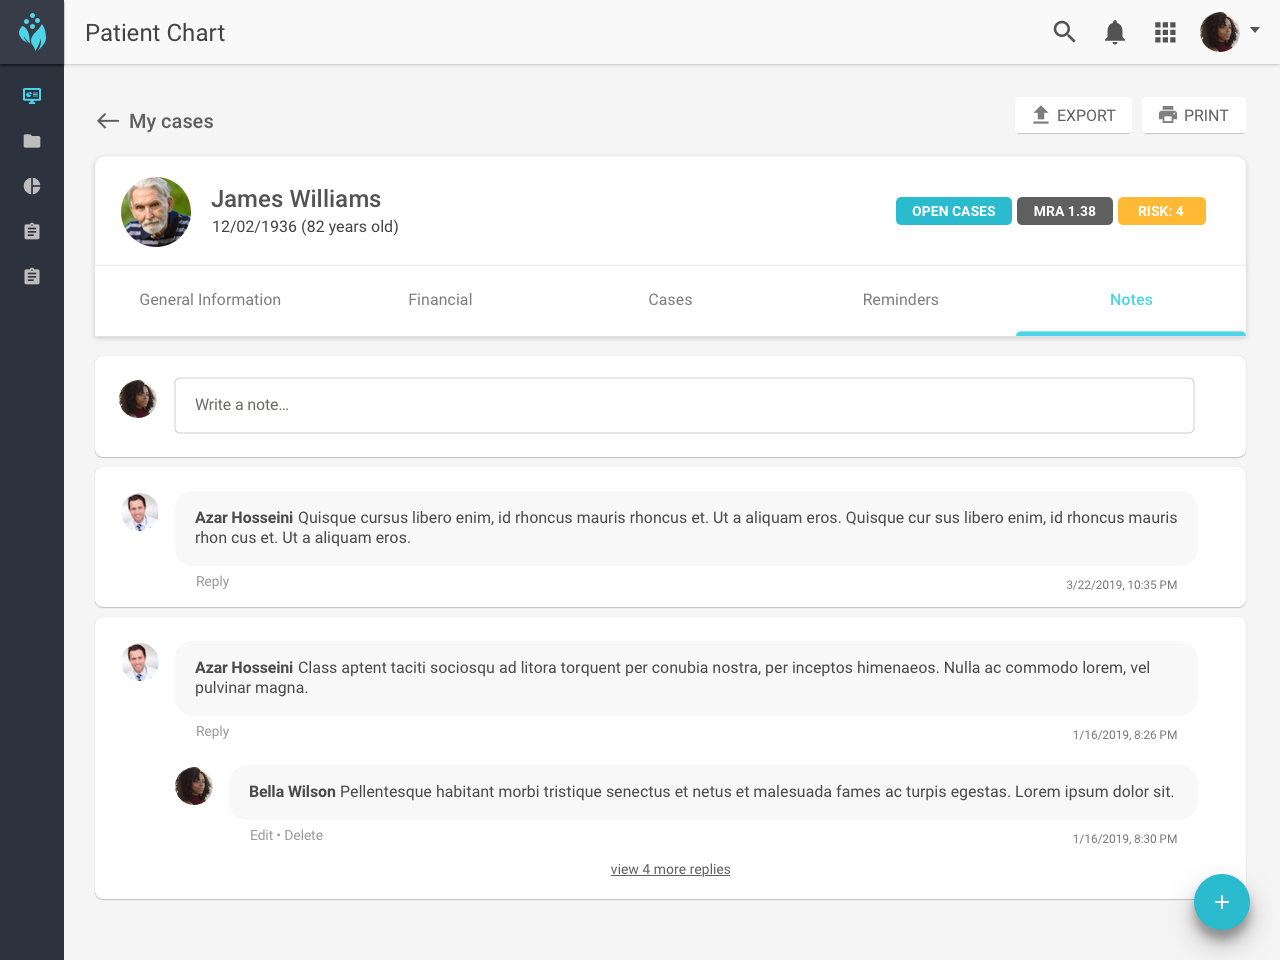
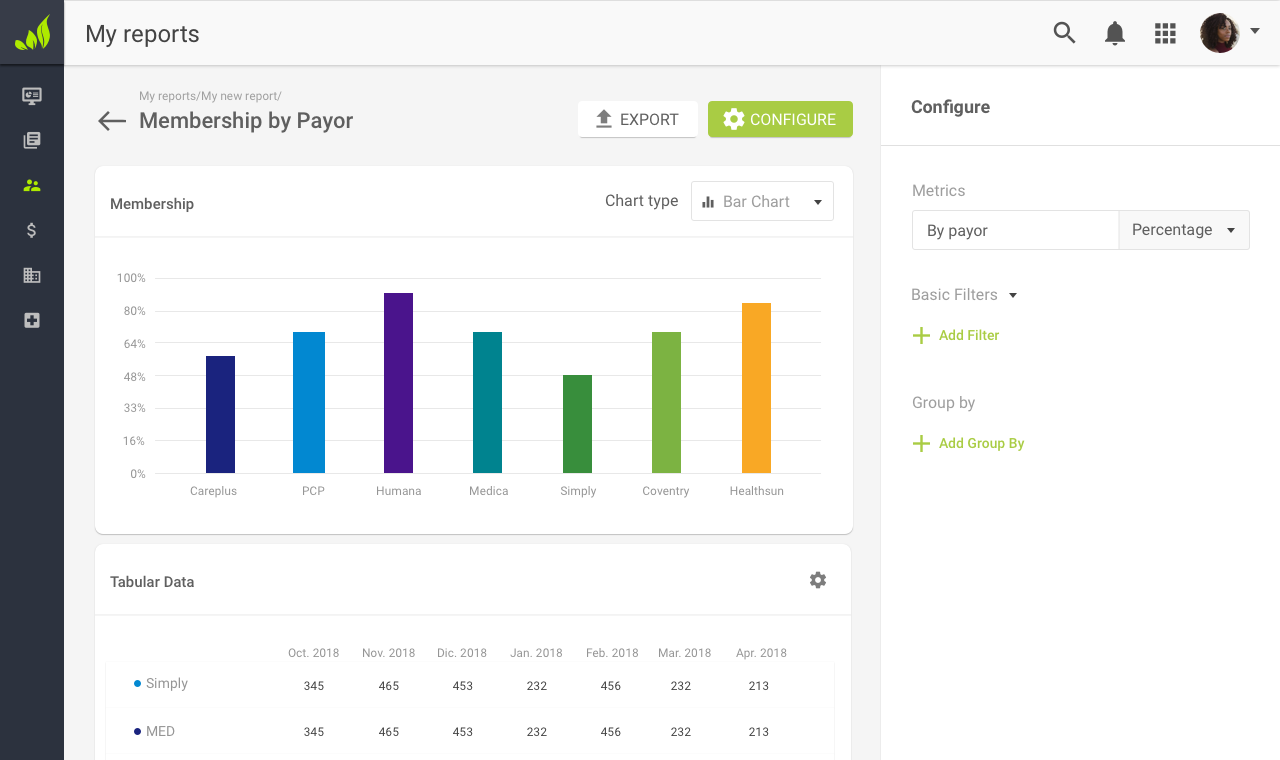
- Define UI: that will be used throughout the three applications.
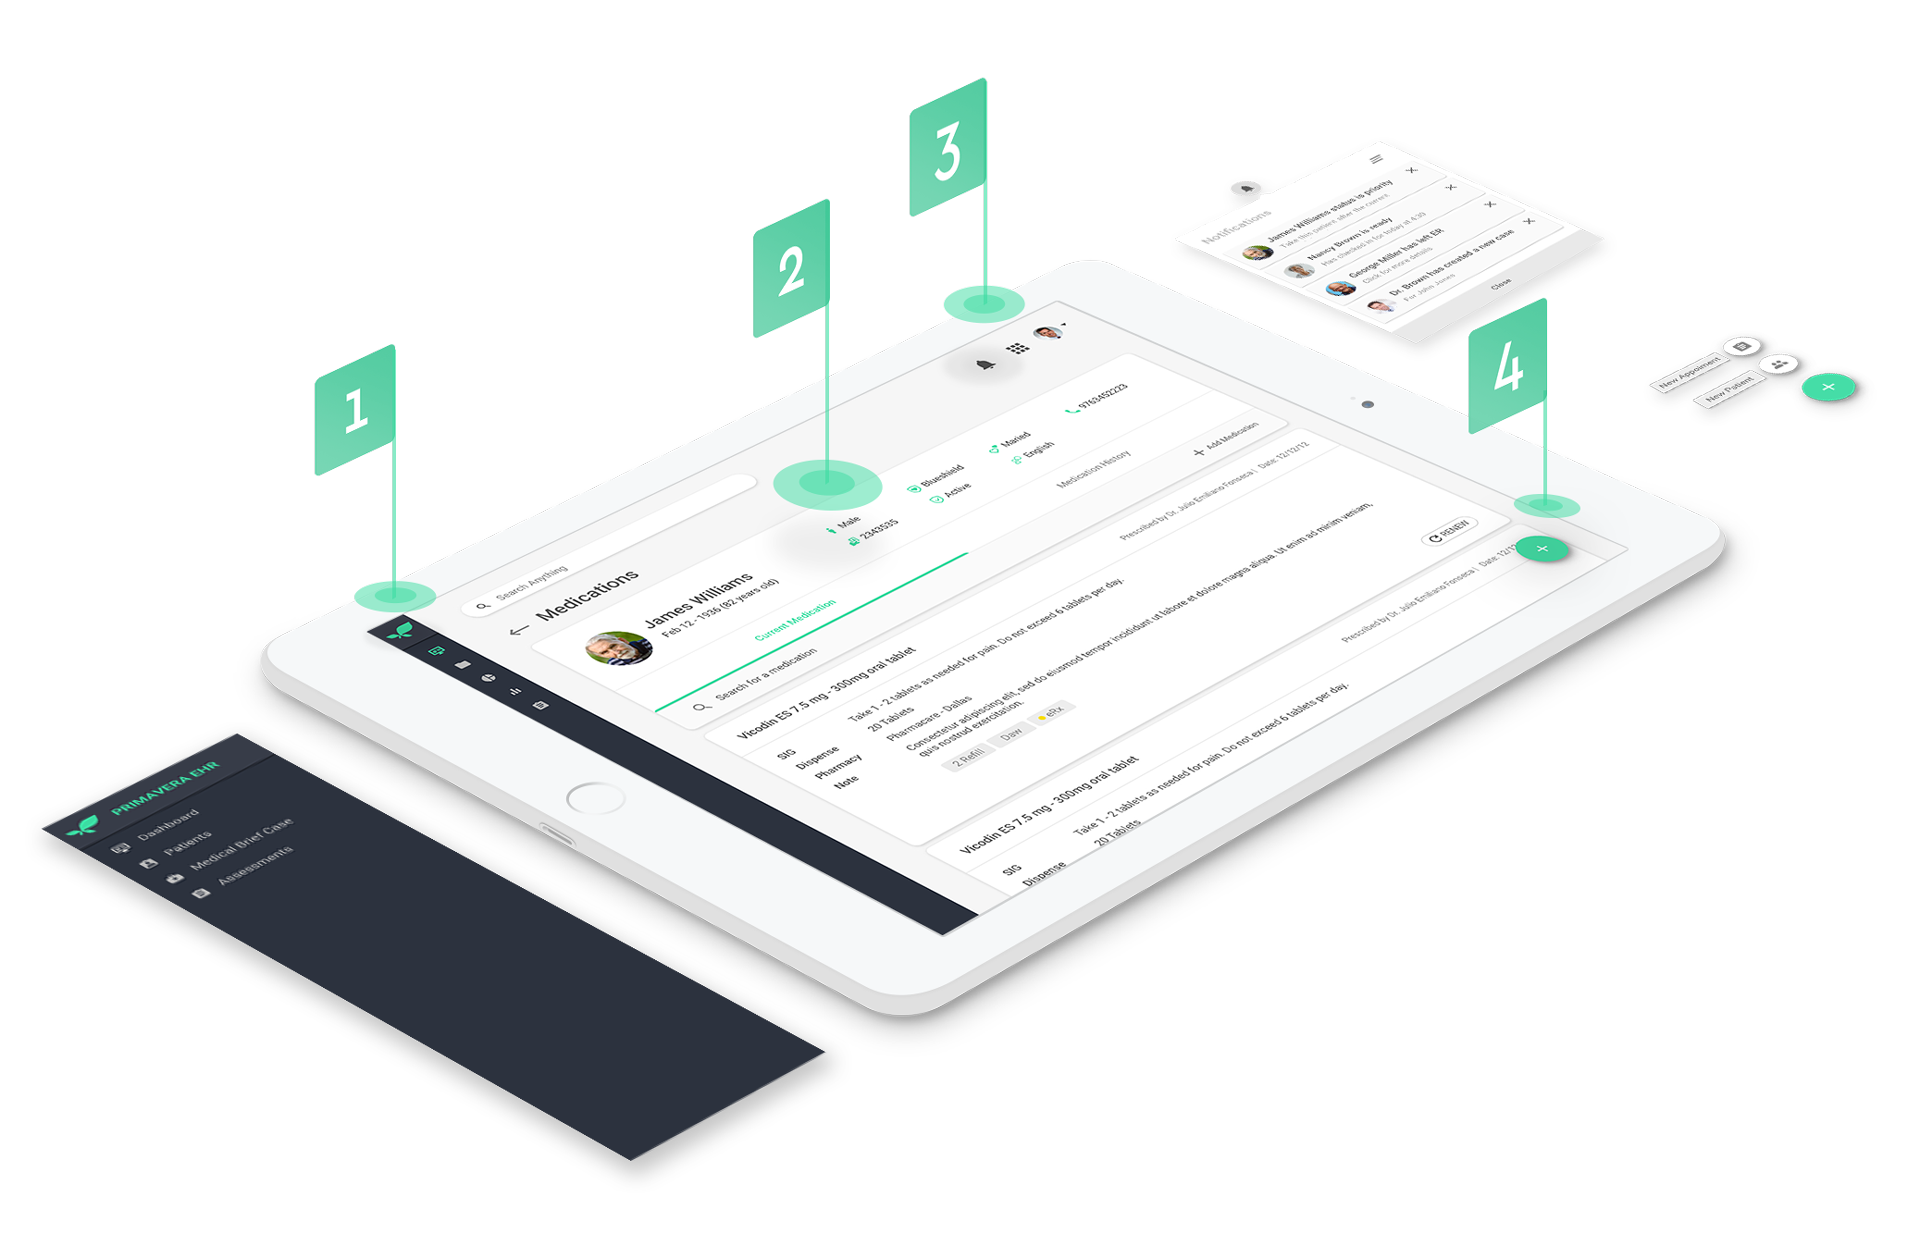
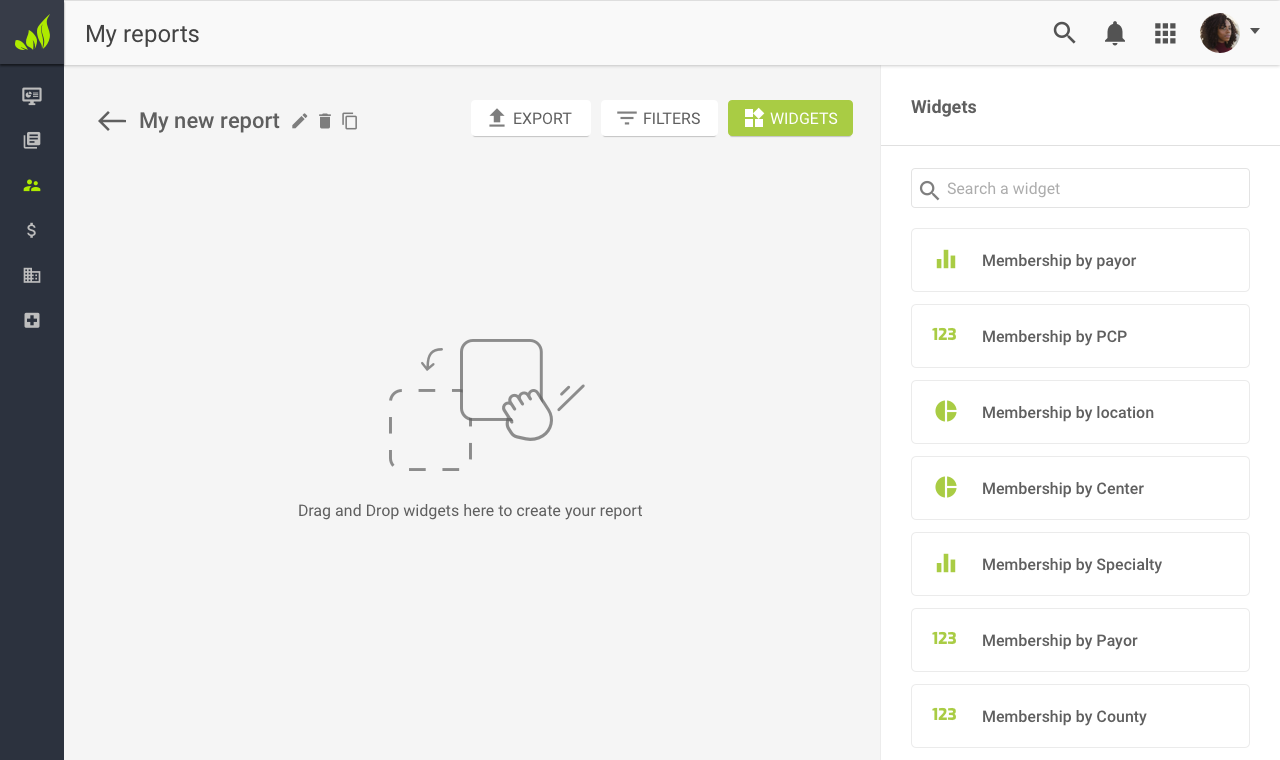
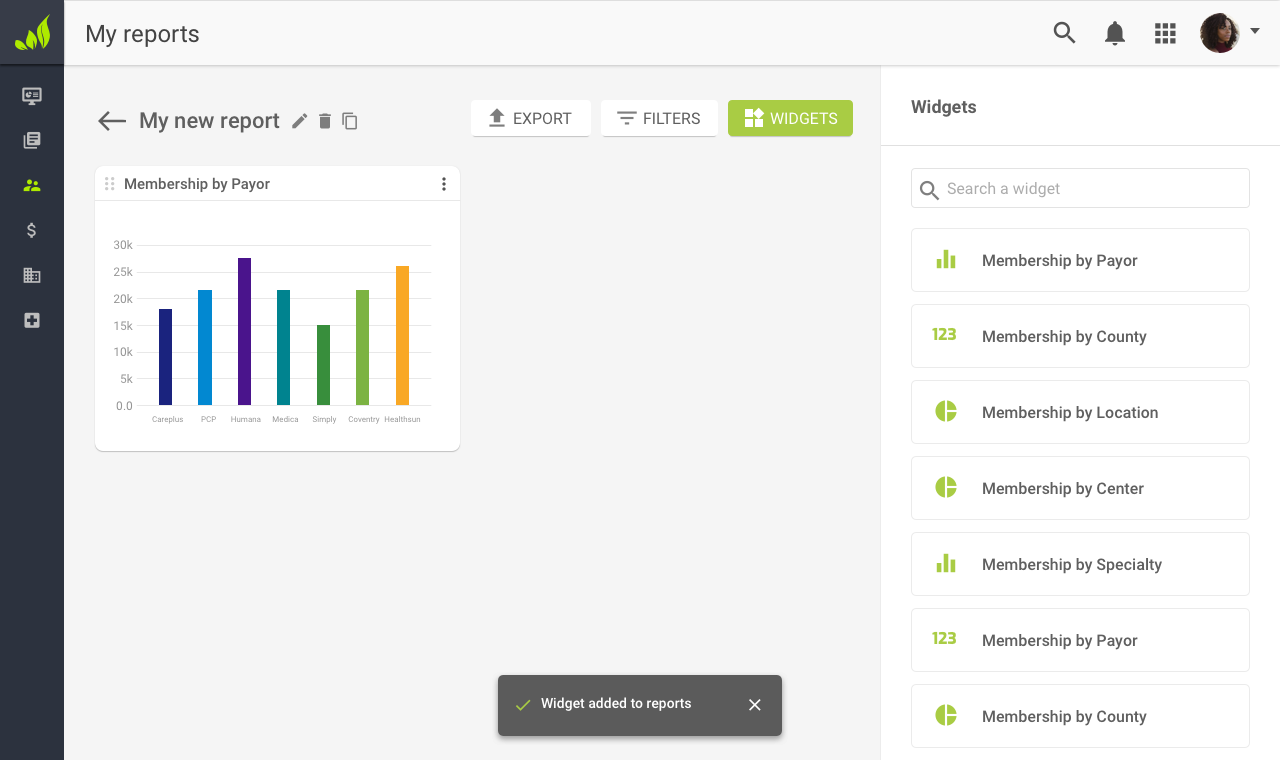
- Created high fidelity mockups & prototypes to test and refine where necessary.
- Iterate design: Based on the feedback received by the product's owner and clients made the appropriate adjustments.
- Handover the assets to the development team: and check on the progress regularly to ensure it is aligned with the design provided.
Team
Product owner, project manager, two ux/ui designers and six developers.